02-Oct-2013
For that case the DDS generates frequencies like 10,000,100 Hz or 10,000,010 Hz given a standard 5 or 10 MHz reference. The alternative is a separate (and perhaps custom) OCXO with a large mistuning.
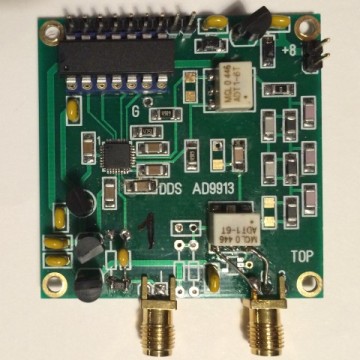
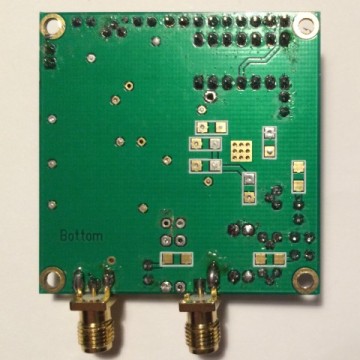
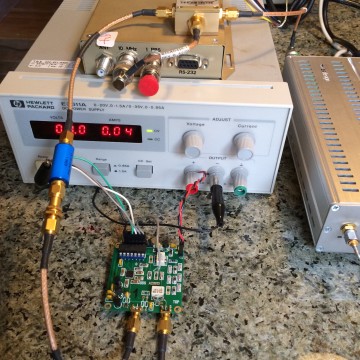
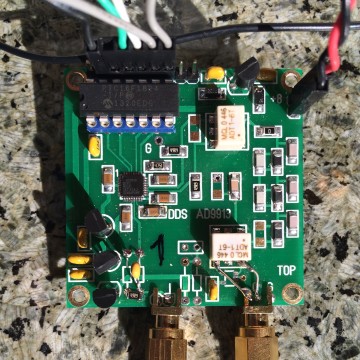
The board contains a PIC microcontroller which detects jumper settings at power-on and sends the appropriate DDS configuration words to the 9913. A photo of a prototype is seen below.
The 9913 is attractive for several reasons. In addition to being high-performance, inexpensive, and having an internal PLL, it also has a programmable modulus feature. Normally any 32- or 48-bit binary accumulator-based DDS can get extremely close to a given decimal frequency such as 10000010 Hz – but not perfectly close. 10000000.940636 or 10000001.033768 is not 10000001.000000.
For most frequency generation applications, this mathematical imperfection is either not measurable or not a problem. But in the world of precision timekeeping, the accumulated loss of even a single nanosecond is intolerable. A programmable modulus can be used to overcome this problem. Given exactly 10.000000000 MHz the 9913 is able to generate 10.000001000 MHz – exactly.
Ironically, for use in a single- or dual-mixer frequency measurement system, it doesn't actually matter if the offset frequency is exact or not. But when a DDS is used in timekeeping applications, exact frequencies are important since frequency error over time becomes accumulated time error.
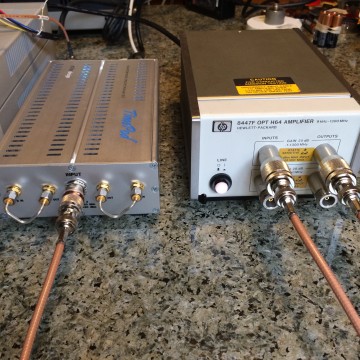
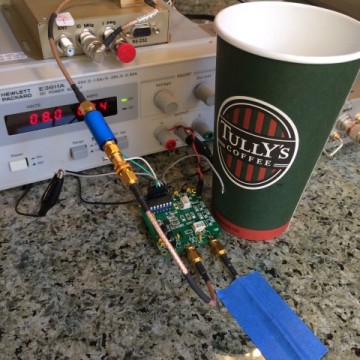
Using a modern phase noise or time interval measurement system it is simple to measure the performance of a 10 MHz DDS. We just split a clean 10 MHz signal in two; one half goes directly to the analyzer (reference input) and the other half goes through the DDS on its way to the analyzer (device input). This is analogous to the half-silvered mirrors in an optical interferometer. The test bench layout is shown below:
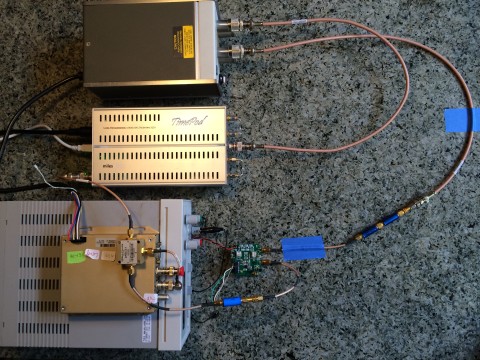
The board gets 8 VDC from a hp E3611A power supply. A free-running, well-aged, low-noise, Trimble Thunderbolt OCXO provides a stable 10 MHz reference. This RF is passively split with a Mini-Circuits ZFSC-2-1. Given the weak output of the 9913 board, a hp 8447 RF amplifier is used in the output path. Mini-Circuits SAT-series attenuators are used to adjust power levels. A TimePod 5330A is used to measure phase noise and phase/frequency stability of one 10 MHz path relative to the other.
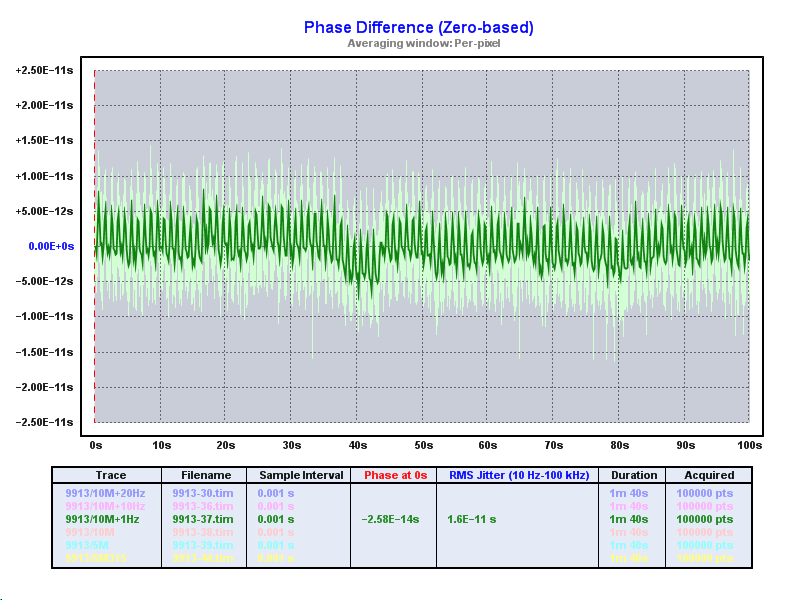
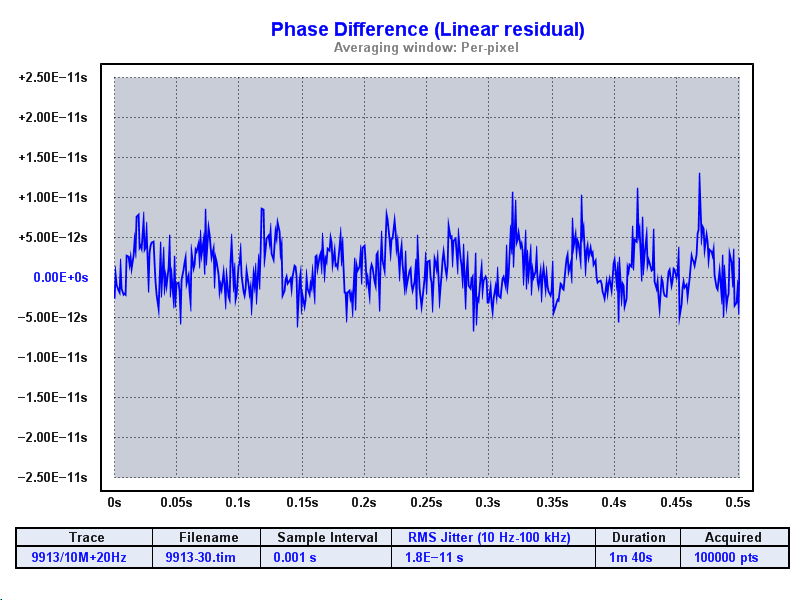
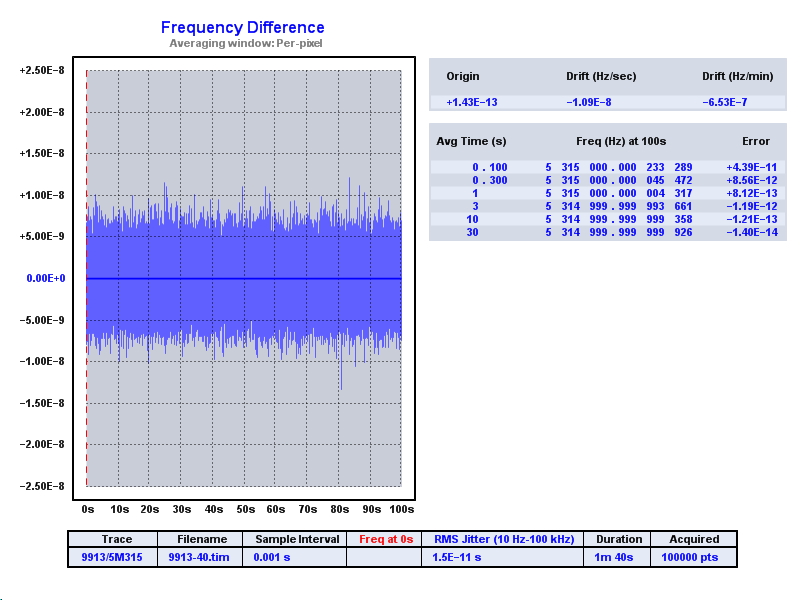
We start with the DDS set to 10.000020 MHz (10 MHz + 20 Hz).
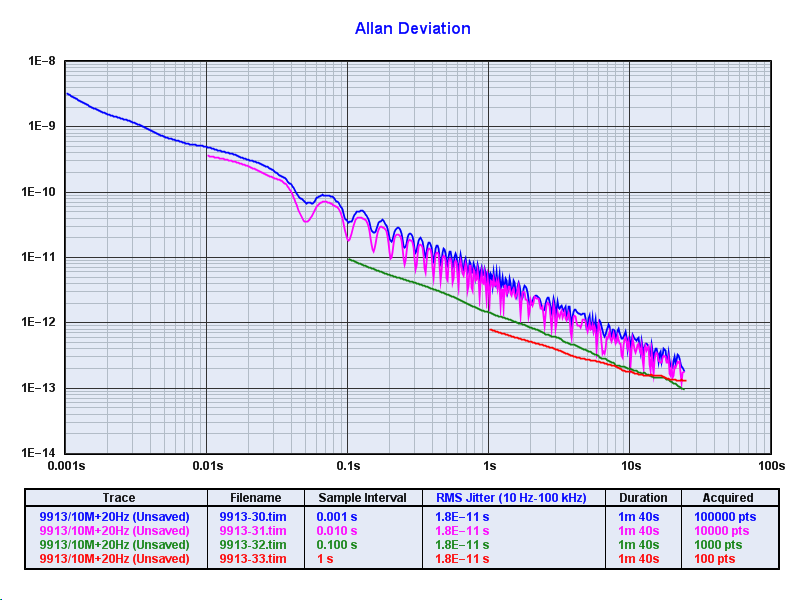
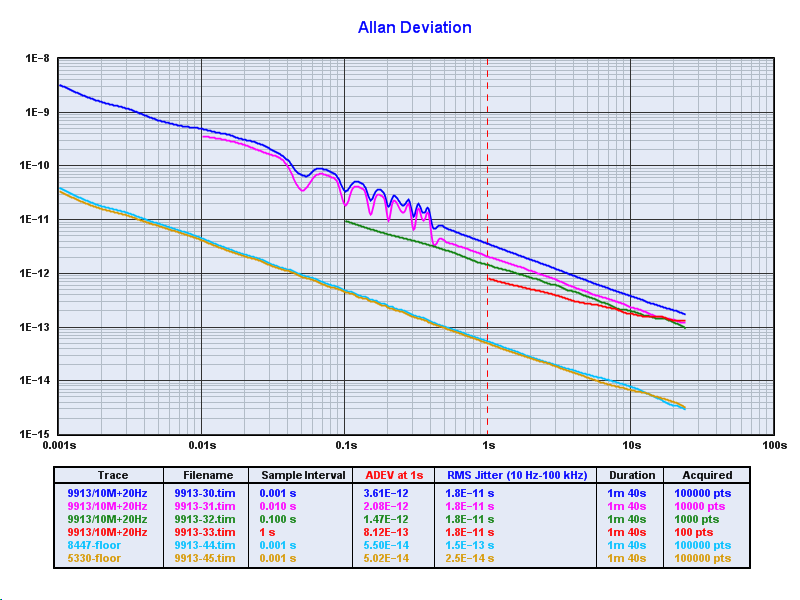
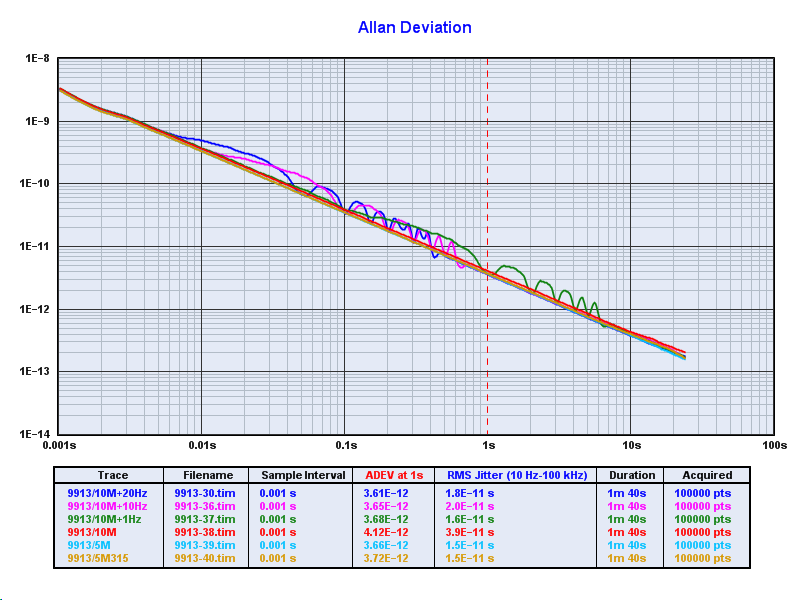
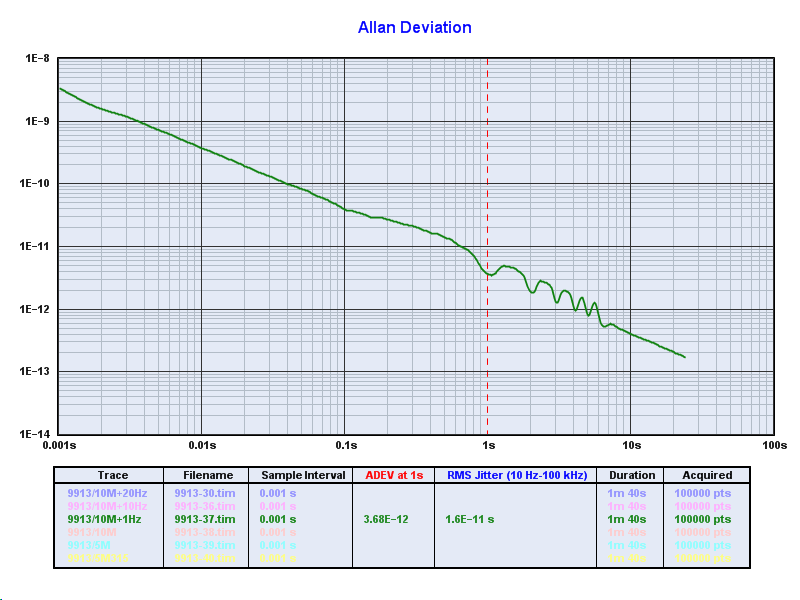
For time domain measurements the sample rate (measurement bandwidth) can have an effect on stability. To explore this effect a 100 second run was made at each of four sample rates (1 ms to 1 s). Here is the ADEV plot:
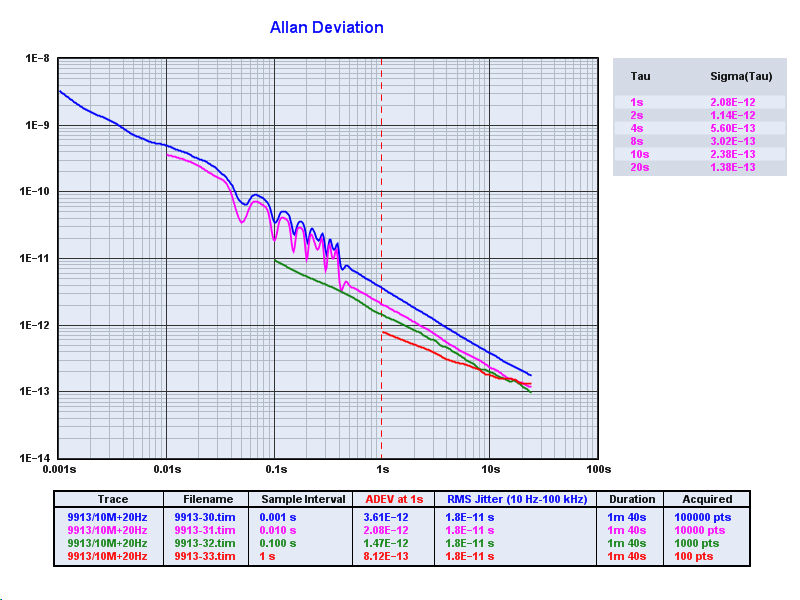
The slightly different levels of instability based on bandwidth is expected. The "wiggles" in the ADEV plot between 0.05 s and 0.5 seconds is interesting and suggests some crosstalk between the input and output frequencies. More on that later.
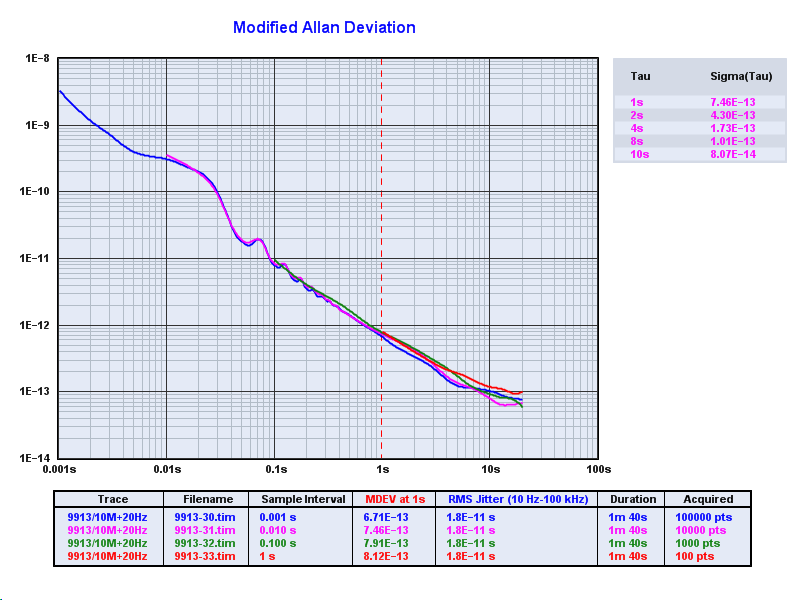
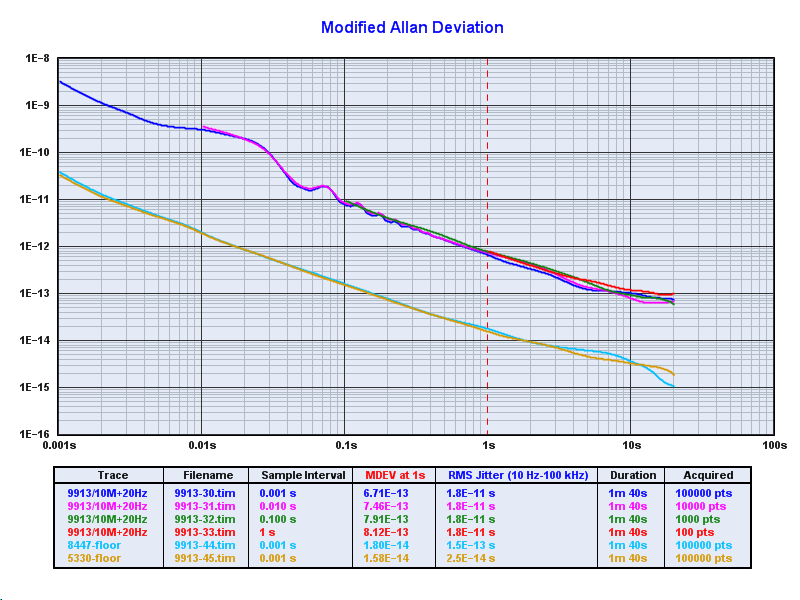
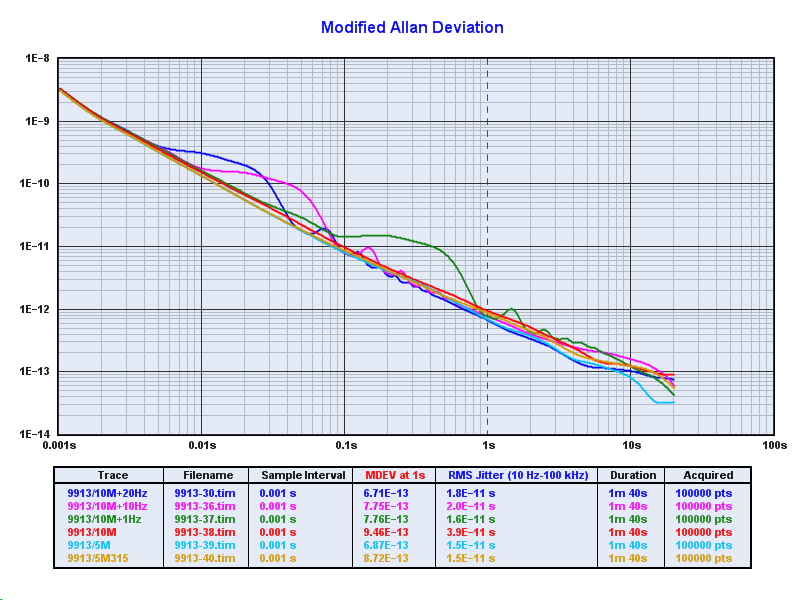
Bandwidth dependencies vanish and modulation effects are smoothed with Modified Allan deviation. Reducing the entire test to a single point, it is safe to say this board is stable to 1 ps @ 1s. From this number alone we can conclude that the board has succeeded in its goal as a replacement OCXO offset generator. Here is the MDEV plot:
I should point out that in cases like this DDS (where significant phase or frequency modulation is present) the appearance of the ADEV plot above is affected by the number of "bins" that TimeLab uses to compute ADEV. It appears as if the ADEV modulation starts at tau 1/20 second and ends at tau 1/2 second. Intuition tells you this cannot be the case, and sure enough, when the number is bins is increased to a larger value (100), the plot looks like this:
If there is any doubt about the modulation, one can instead use a tool that does not have bin limitations. The Stable32 plot below shows ADEV and MDEV correctly.
But the point is – this DDS is stable to 1ps @1s and if you look closer there are 10 MHz intermodulation effects. Note that TimePod hardware records the raw data faithfully and TimeLab software correctly reveals that modulations are present. With sufficient PC patience, Stable32 all-tau mode can be used to creates a more faithful ADEV plot.
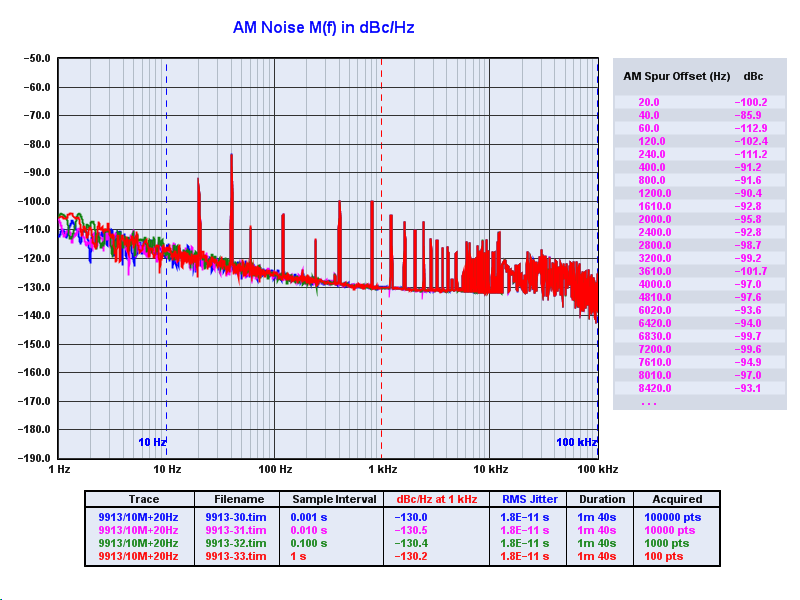
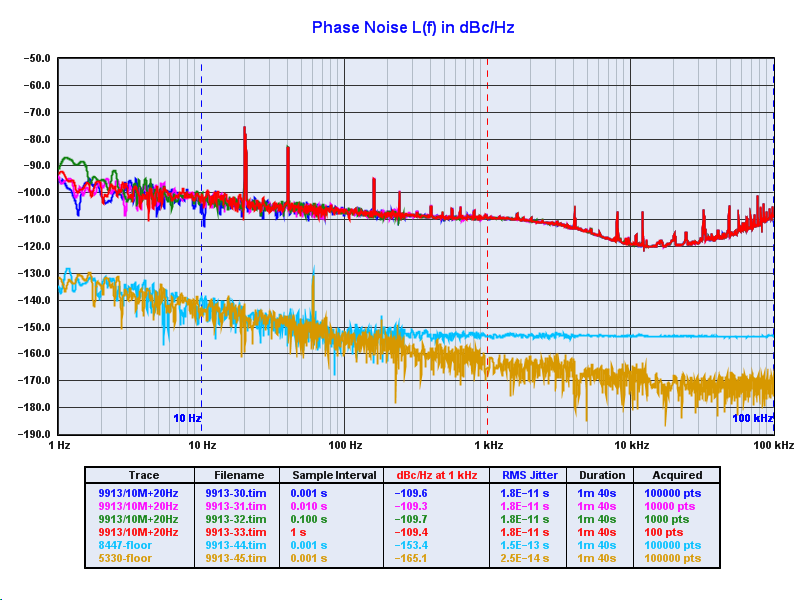
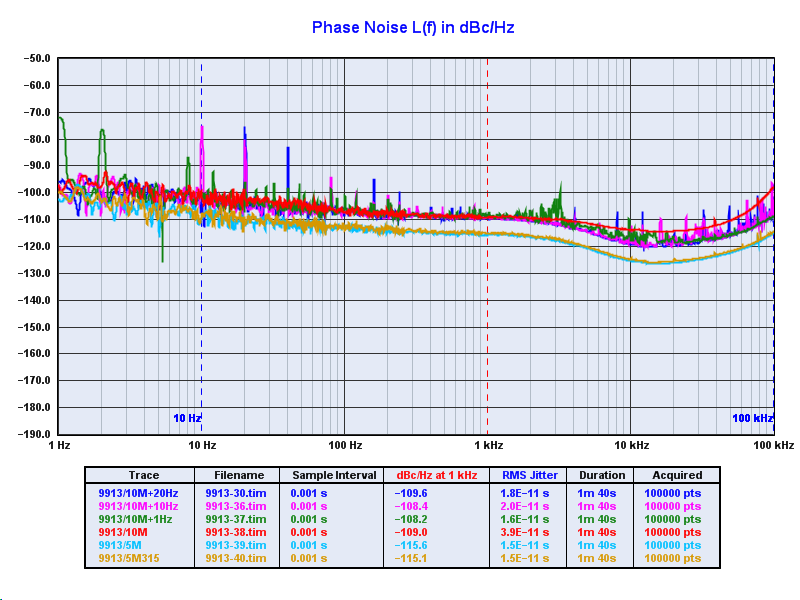
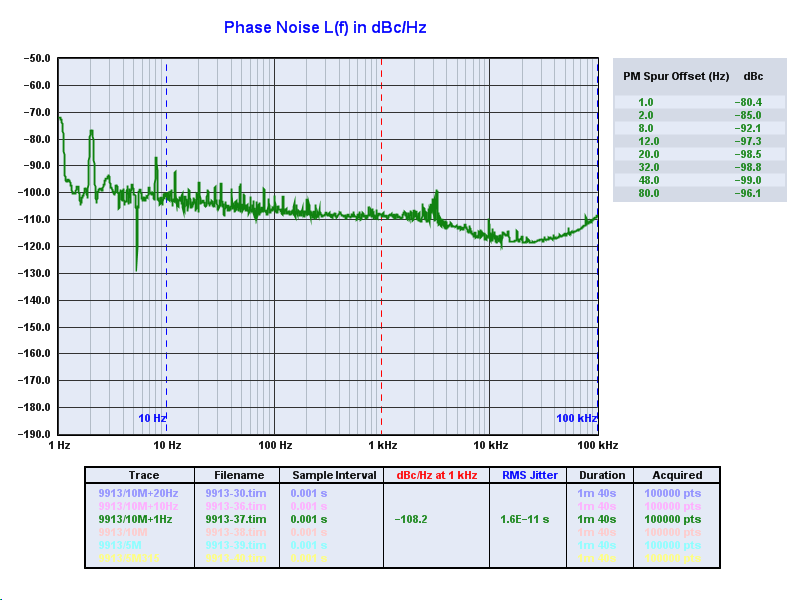
All four runs showed the identical phase noise spectrum. This is expected since ADEV sample rate is unrelated to phase noise. Jitter (for 10 Hz to 100 kHz) is 18 ps. The TimePod is unable to measure phase noise out to MHz regions. The phase noise looks about 10 dB worse than the AD9913 data sheet (Figure 12). Determining the source of this is a worthwhile effort.
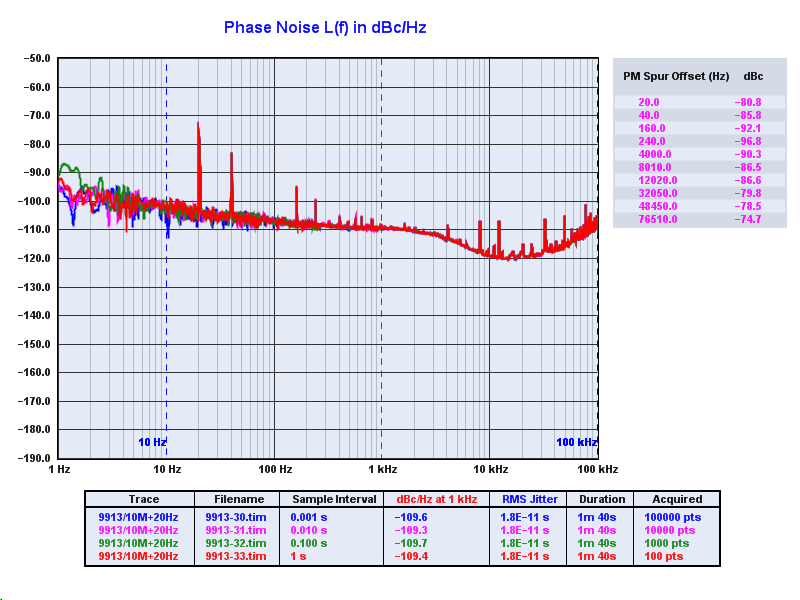
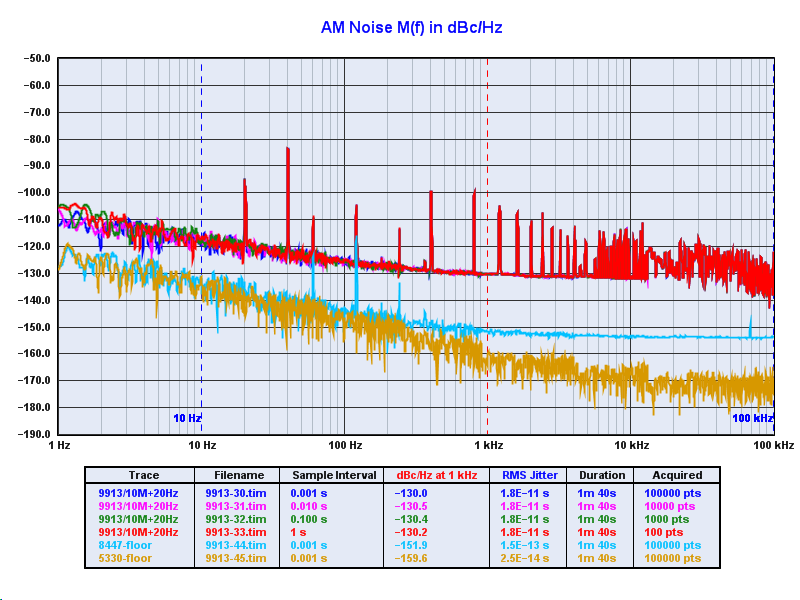
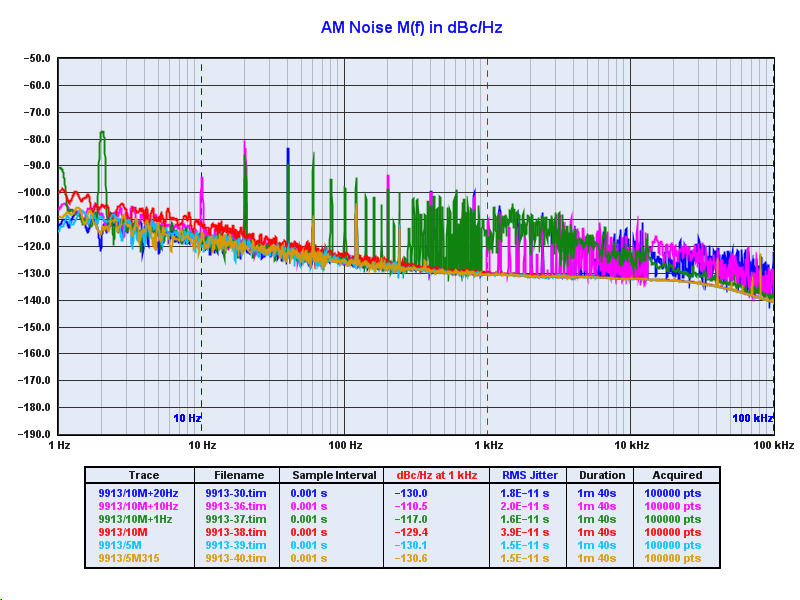
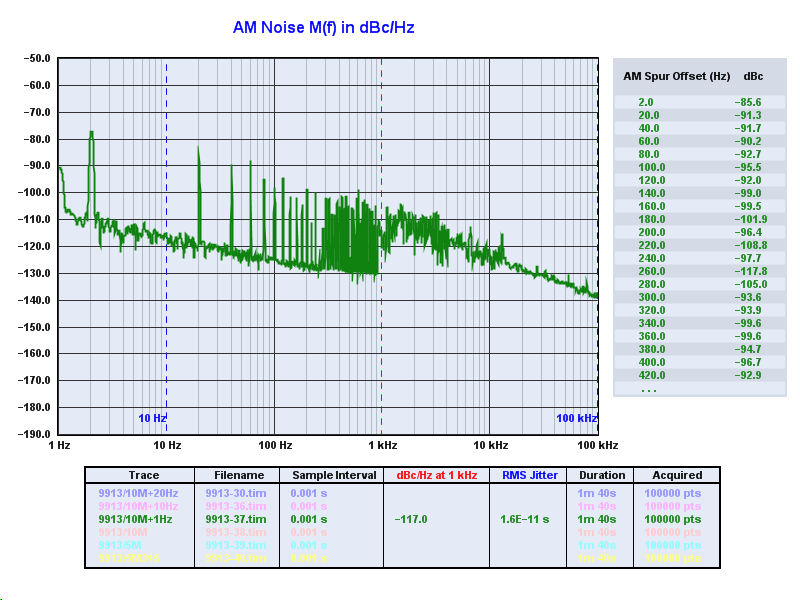
The amplitude noise spectrum also shows strong 20 Hz harmonics.
Two noise floor tests were performed. First, the 9913 was removed from the measurement loop. This measured the noise floor of the 5330 TimePod and the 8447 RF amplifier. Second, the amplifier was also removed so that the noise floor of only the TimePod was measured. In both cases SMA attenuators were added or removed to match existing power levels.
Measurements were also performed using a 8447A amplifier, and both the top and bottom halves of the 8447F amplifier. Those results were interesting, but not relevant to this 9913 experiment.
Below are the same set of plots as above, except showing the measurement system also. They clearly show the measurement noise is far below the 9913.
In cases like this, TDEV is easier to read than MDEV (since it avoids the -1 slope).
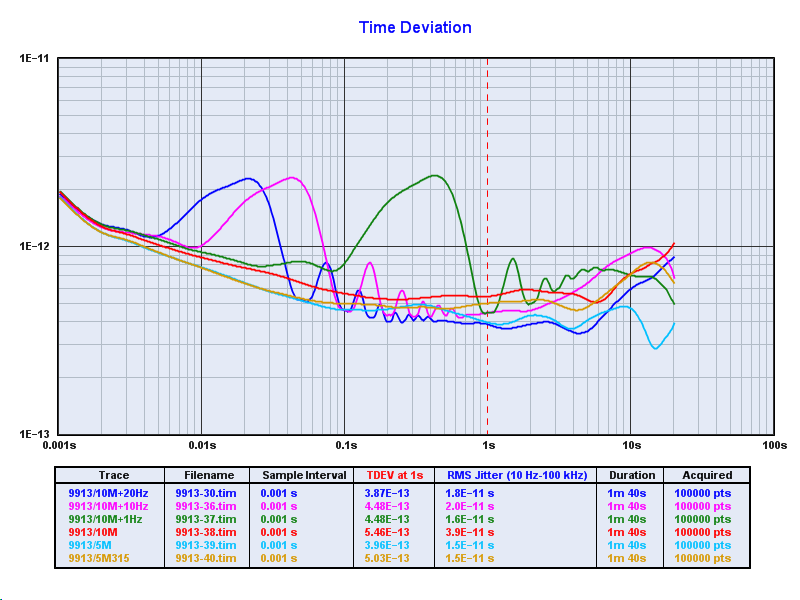
Phase noise spurs follow beat frequencies as expected. Phase noise for the 5 MHz outputs is less than the 10 MHz outputs as expected.
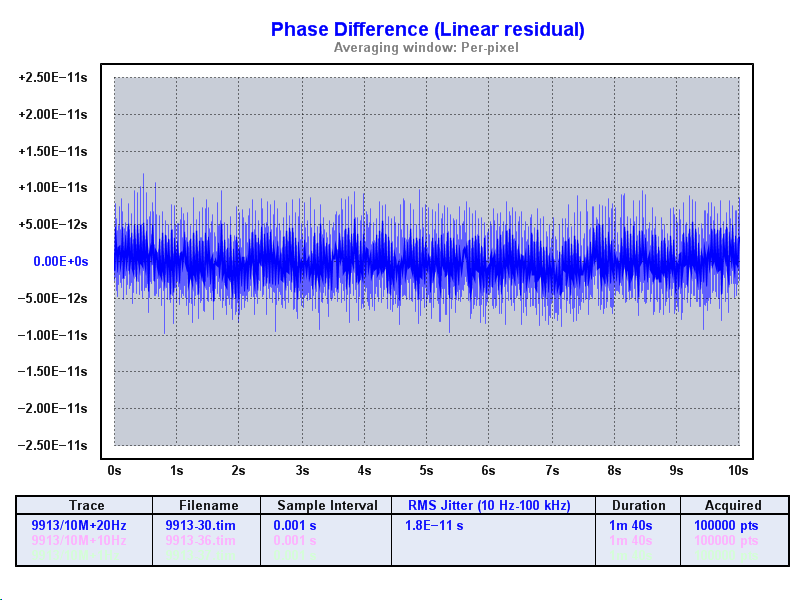
Here is the 20 Hz plot by itself:
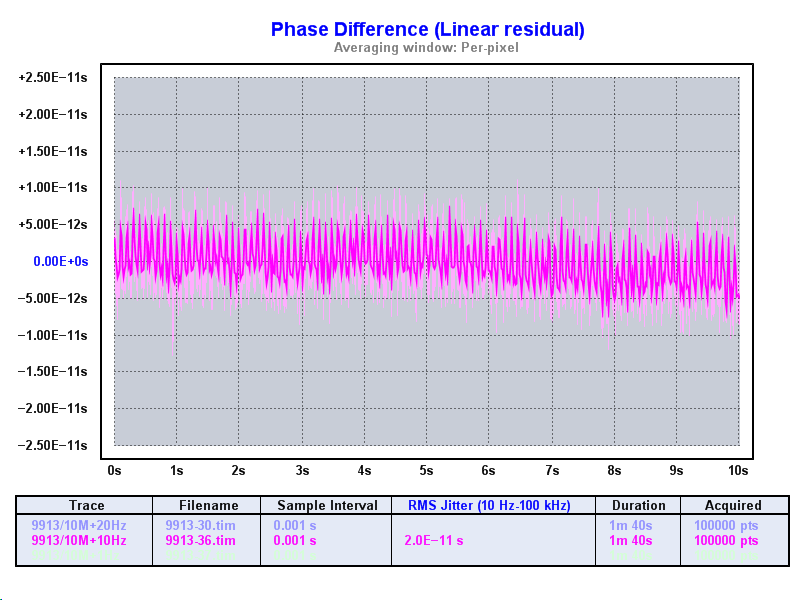
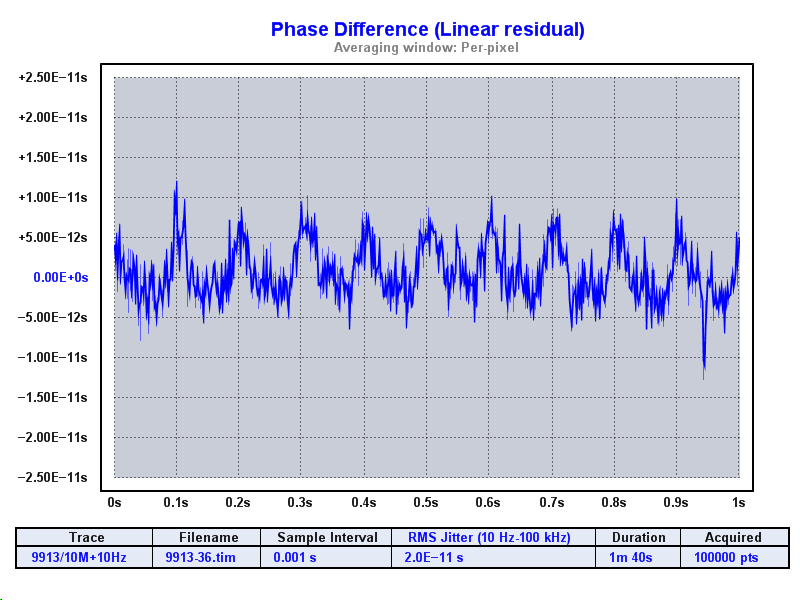
Here is the 10 Hz plot by itself:
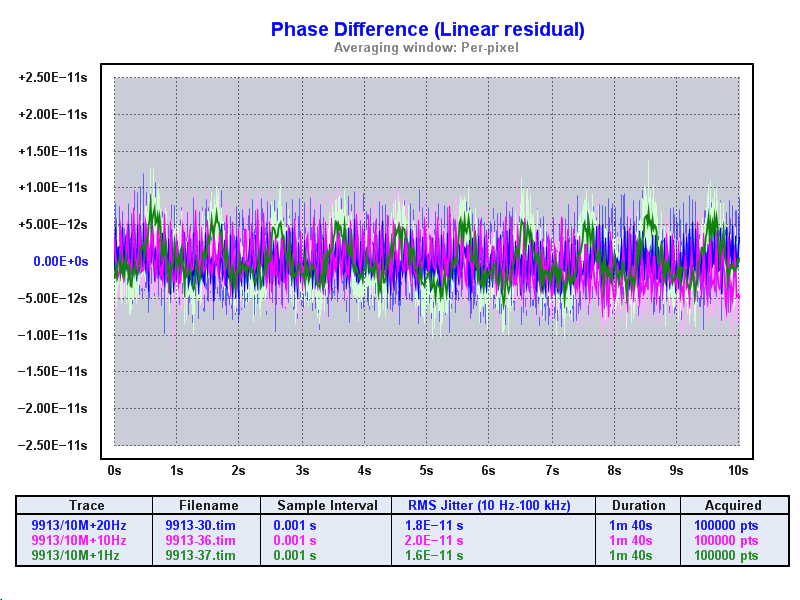
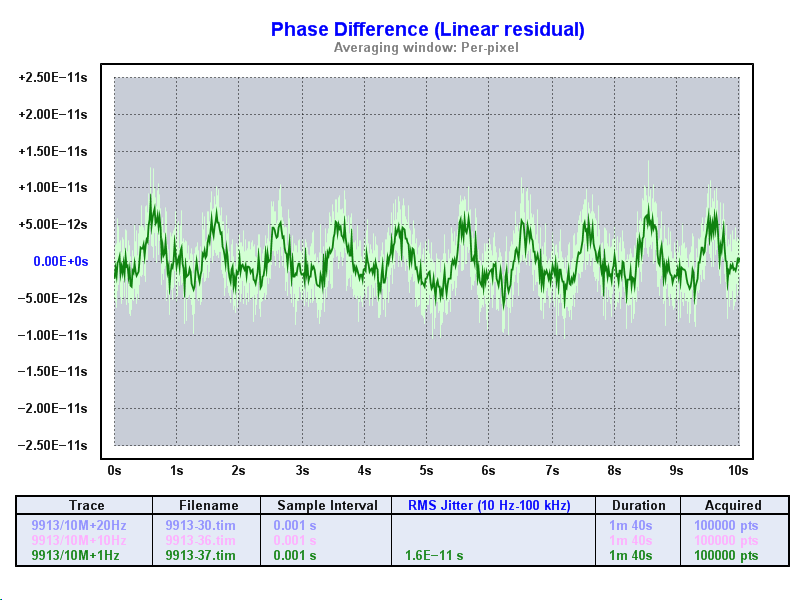
Here is the 1 Hz plot by itself:
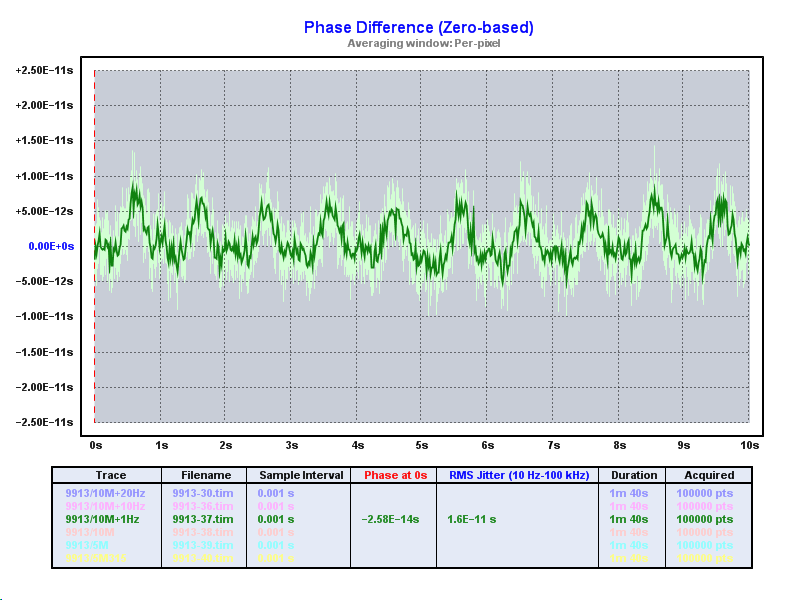
To better compare the waveforms, we adjust the horizontal scale to view 10 cycles each.
10 cycles of 20 Hz (0.5 seconds elapsed time):
10 cycles of 10 Hz (1 second elapsed time):
10 cycles of 1 Hz (10 seconds elapsed time):
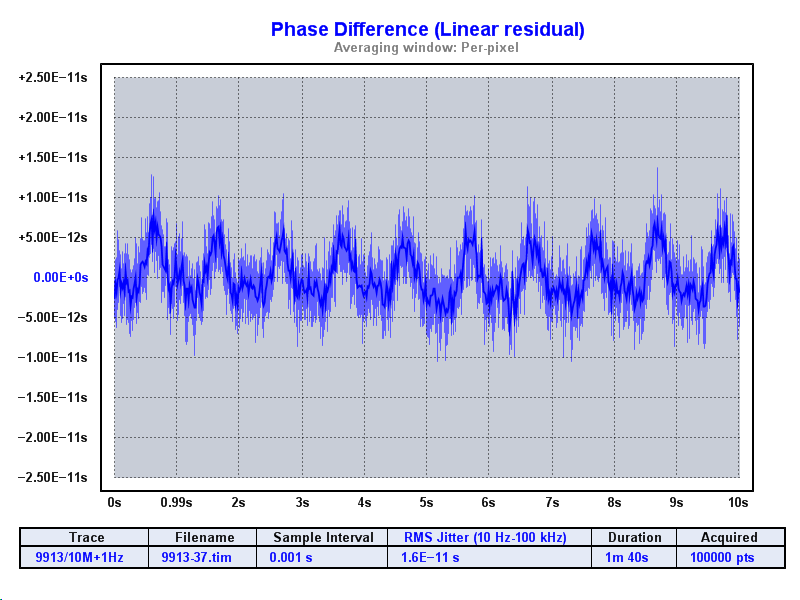
The period of 10 MHz is 100 ns and the 9913 has 14-bit phase resolution. Note that 100 ns / 16384 = 6.1 ps, which is very close to the magnitude of the modulation we see here. Coincidence?
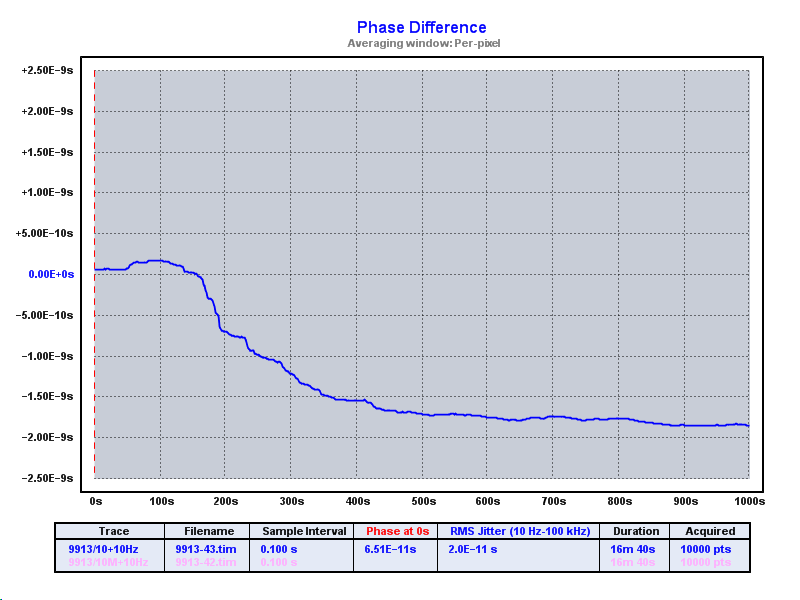
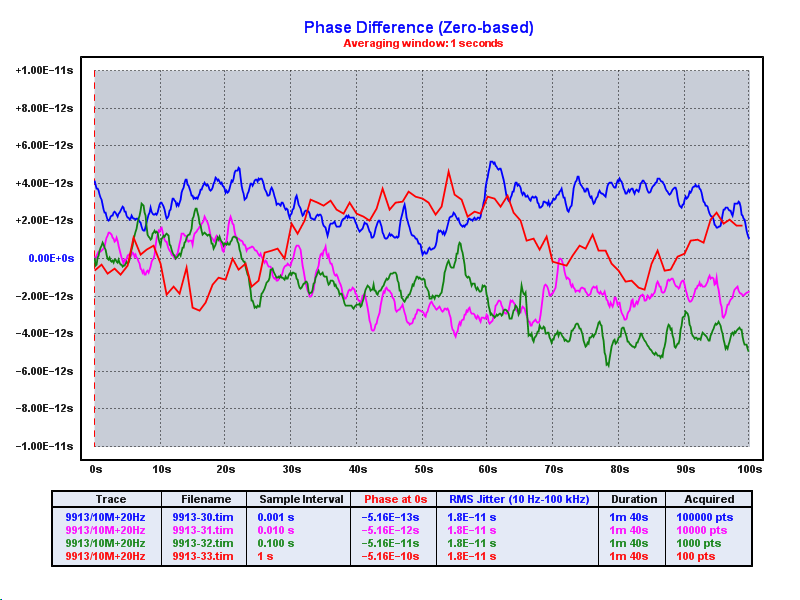
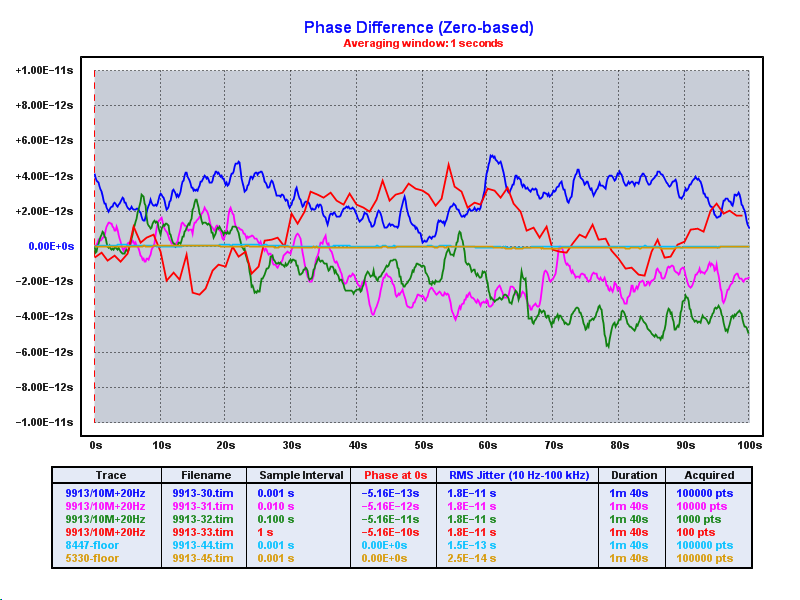
When looking at the phase record of the 1000 second run, there is some drift, in this case about 20 ps. This is likely environmental.
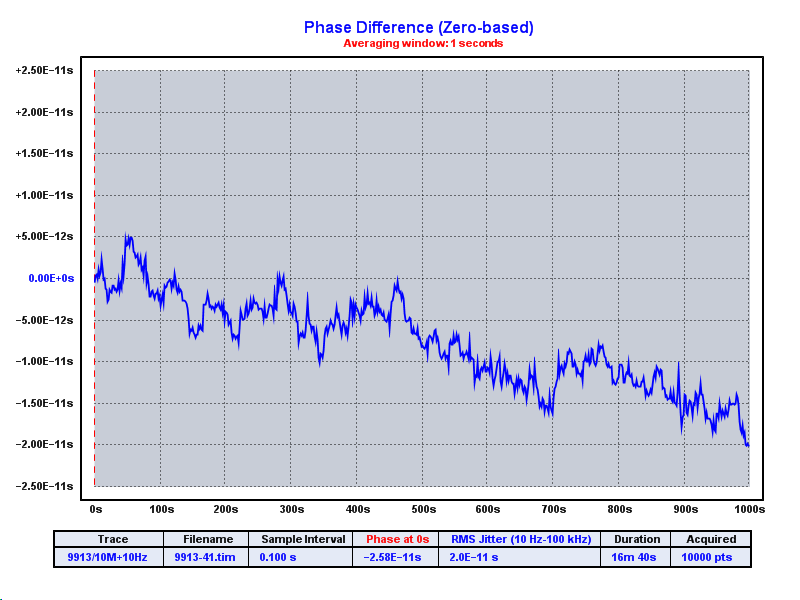
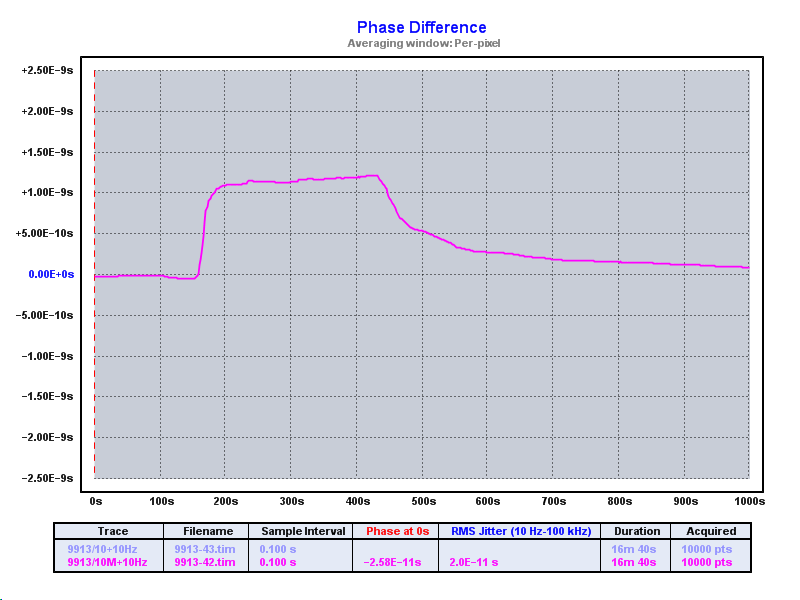
As a quick check for temperature sensitivity I started another 1000 second run. After about 100 seconds I placed a cup with just 2 inches of hot coffee next to the board to see what would happen. At the 400 second mark, I removed the cup.
The effect on phase for this uncalibrated temperature experiment was quite large; over 1 ns. That is hundreds of times more than the magnitude of the jitter and wander seen above.
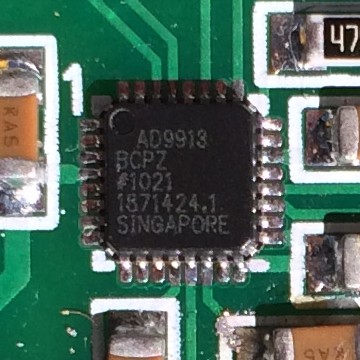
Later I noticed direct sunlight on the bench (unusual for Seattle) so I started another 1000 second run as the light slowly faded. You can see strong shadows in the photos below. BTW, all photos on this page were taken with an iPhone 5S. The photo on the right is a crop of the photo on the left; amazing resolution.
As the light faded over 10 minutes the phase changed by 2 ns.