LeapSecond.com > Museum > Time Sources > 60 Hz Mains Frequency
11-Mar-2004
The 60 Hz power line frequency is known to be relatively stable. The integrated frequency, or time-keeping aspect of frequency, is also quite accurate. This is why AC electric wall clocks keep exceptionally good time.
But just how accurate is the mains frequency? Is it 60 Hz or 60.000 Hz or even 60.000 000 Hz? The answer depends on how close you look; over what time span you average. I know of no electric appliance that cares if the frequency is 59 Hz or 60 Hz or 61 Hz. With the exception of a wall clock, perhaps even as low as 50 Hz or as high as 70 Hz is ok.
For wall clocks the main thing is how accurate is the average frequency? Is a wall clock accurate to 5 seconds a day? a week? a month? The power industry has standards for all this, I'm sure, but let's see how stable the mains frequency really is.
It is not that difficult to devise a circuit that marks zero-crossings of the 60 Hz AC waveform. And also not difficult to periodically measure the phase against a known time standard, such as a 1 PPS signal from an OCXO, or GPS receiver, or cesium clock.
For this experiment I used a TrueTime TFDM (Time/Frequency Deviation Meter) card on a XL GPS receiver. The output was logged every second. A sample of the log file is shown below. The columns are instantaneous frequency, instantaneous phase change, net phase gain/loss since power-up, mains hour, minute, second, and UTC hour, minute, second.
59.994 -0.006 -00.848 04 09 04.152 230 04 09 05 59.992 -0.008 -00.857 04 10 04.143 230 04 10 05 60.002 +0.002 -00.861 04 11 04.139 230 04 11 05 |
Data was collected for several months. Occasional PC crashes or re-cabling caused gaps in data. A power failure over Christmas caused a gap in continuous phase tracking. But otherwise it is a good data set; adequate to draw many conclusions.
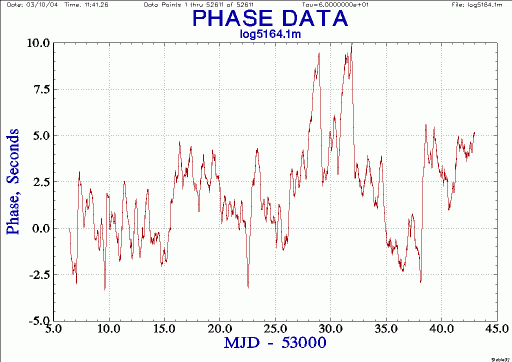
The following is about a month of data from January 2, 2004 (MJD 53006) to February 6, 2004 (MJD 53042).
| Power line phase error chart |
 |
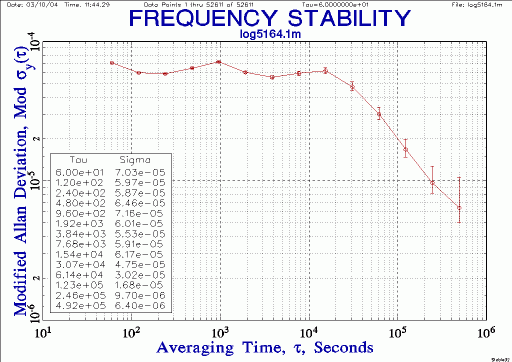
Using 1 minute samples here is an Allan Deviation plot.
| 60 Hz mains frequency stability for tau 1 minute to 1 week |
 |
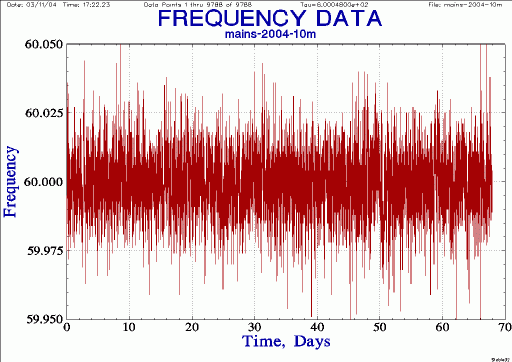
A 1 second frequency sample was taken every 10 minutes. Here is the plot:
| Frequency plot showing 10 minute averages |
 |
// todo //