21-Dec-2006
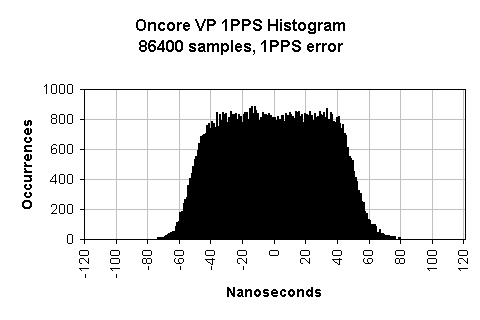
The Oncore VP hardware 1PPS is usually within +/- 52 ns of the correct value. What is the distribution? Is it evenly spread exactly between -52 ns and +52 ns of the true value? Below is a histogram of one day of data (86400 samples):

We can see that, yes, the distribution is very evenly spread with a width close to the expected 104 ns. The slight excursion beyond +/- 52 is expected since the measured 1PPS will contain both GPS system and receiver jitter in addition to the +/- 52 ns quantization jitter (often called sawtooth error).
The sawtooth-like look is the result of a gradual phase drift, which wraps anytime the 104 ns window is exceeded. This usually results in a series of ramps, with varying pitch. What is the typical slope of the ramp? How many wraps per minute? This is determined solely by the rate of phase drift.
If each 1 Hz phase measurement is, say, 5 ns more than the previous one, it will take about 20 samples before there is a wrap; the ramp will last 20 seconds (104 ns / 5 ns = ~20).
Or, if each 1 Hz phase measurement is 15 ns less than the previous one, the ramp will be only about 7 seconds long (104 ns / 15 ns = ~7) and be slanted in the other direction.
If the there is near alignment with the internal GPS receiver XO the phase may drift very gradually, just a nanosecond or two per second and one sees a near flat line. Or if the sign changes during slow drift one may see a convex or concave pattern, that can look like bridges.
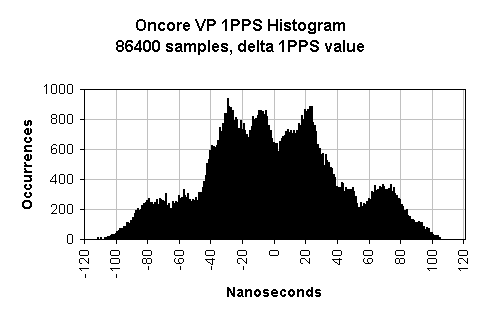
For lack of a better word, I'll call the difference between successive 1PPS errors the phase delta. Big phase deltas result in rapid wrapping. Small phase deltas result in slow ramps or brides.
Below is a histogram of the phase deltas; the difference between any one measurement and the next:

We see this is not at all evenly spread, even with one entire day of data. I guess this is not unexpected but I can't explain it yet.
Might this Patagonia-looking pattern change from day to day or from VP to VP? Would it look different at different ambient temperatures? Would 100 days of data instead of 1 day help?

(see www.mountainlight.com/gallery.classics/images.html)
I remember looking into sawtooth error with my VP when I first got it, specifically the issue of the length of the cycles. With the miracle of google here's what I found in 1997.
http://ftp.iasi.roedu.net/mirrors/ftp.tapr.org/tac2/mail_archives/tacgps.9710 Date: Fri, 10 Oct 1997 16:38:33 -0500 (CDT)
Originator: tacgps@tapr.org
From: Tom Van Baak
Subject: [TACGPS:748] Re: TOC -- Block Diagram
X-Comment: Tucson Amateur Packet Radio
Status: RO
Dr Thomas A Clark (W3IWI) wrote:
[snip]
> I envisioned the time-base counter running at 20 MHz clock (simple
> doubler from the 10 MHz xtal) since I want to have at least 50 nsec
> resolution in the timing. The ONCORE rcvr has an inherent 104 nsec
> sawtooth dither (arising from their use of a 9.54 MHz reference to
> derive the 1PPS signal) with ~6 second periodicity (as an example,see
> ftp://aleph.gsfc.nasa.gov/GPS/totally.accurate.clock/tac-1sec.gif )
Yes, I first thought the Oncore 104 ns sawtooth effect was
a real pain but it turns out this unintentional dithering
is very handy in the TOC case, isn't it.
> But the numbers only arrive at a 1 measurement/second rate, so
> the arithmetic is not to daunting. My experience has indicated
> that we should probably use a 30 to 100 second time-interval average
> as the "normal points" to then feed to the loop averager (which was
> the topic Brooks & I were discussing).
I would be careful about the ~6 second periodicity claim. It
certainly was about 6 seconds during the 8 minutes captured
for that particular plot you created. But it's not always 6
nor that consistent (or maybe it's just *my* Oncore!). The
sawtooth can have positive slope or negative slope or look
like a clothesline. Take a close look at longer runs: I've
seen periods from 1 or 2 to well over 100. This means one
has to be a little careful about using only a 30 to 100
second time interval average, no?
Following are period count histograms for three back-to-back
one hour runs. The third is similar to your GGAO plot but
the first two demonstrate how inconsistent the periodicity
can be.
"3 AM run"
Period Count Instances Percent Cumulative
1 12 7.2 7.2
2 12 7.2 14.4
3 8 4.8 19.2
4 2 1.2 20.4
5 5 3.0 23.4
7 4 2.4 25.7
8 3 1.8 27.5
9 6 3.6 31.1
10 5 3.0 34.1
11 3 1.8 35.9
12 12 7.2 43.1
13 6 3.6 46.7
14 6 3.6 50.3
15 5 3.0 53.3
16 2 1.2 54.5
17 5 3.0 57.5
18 6 3.6 61.1
19 3 1.8 62.9
21 4 2.4 65.3
22 3 1.8 67.1
23 3 1.8 68.9
24 1 0.6 69.5
25 3 1.8 71.3
26 6 3.6 74.9
27 2 1.2 76.0
28 3 1.8 77.8
31 2 1.2 79.0
32 2 1.2 80.2
33 2 1.2 81.4
34 1 0.6 82.0
36 3 1.8 83.8
37 2 1.2 85.0
38 1 0.6 85.6
39 1 0.6 86.2
42 1 0.6 86.8
43 2 1.2 88.0
45 1 0.6 88.6
48 2 1.2 89.8
49 1 0.6 90.4
50 1 0.6 91.0
51 1 0.6 91.6
55 2 1.2 92.8
56 2 1.2 94.0
64 1 0.6 94.6
66 1 0.6 95.2
76 1 0.6 95.8
81 1 0.6 96.4
84 1 0.6 97.0
88 1 0.6 97.6
92 2 1.2 98.8
126 1 0.6 99.4
146 1 0.6 100.0
3600 Samples, 167 Periods
Period Count: 21.6 average, 13.9 median
"4 AM run"
Period Count Instances Percent Cumulative
1 11 6.4 6.4
2 13 7.6 14.0
3 4 2.3 16.4
4 2 1.2 17.5
5 3 1.8 19.3
6 1 0.6 19.9
7 6 3.5 23.4
8 1 0.6 24.0
9 3 1.8 25.7
10 4 2.3 28.1
11 5 2.9 31.0
12 4 2.3 33.3
13 4 2.3 35.7
14 4 2.3 38.0
15 7 4.1 42.1
16 11 6.4 48.5
17 9 5.3 53.8
18 5 2.9 56.7
19 6 3.5 60.2
20 5 2.9 63.2
21 4 2.3 65.5
22 2 1.2 66.7
23 5 2.9 69.6
24 5 2.9 72.5
25 2 1.2 73.7
26 7 4.1 77.8
27 2 1.2 78.9
28 3 1.8 80.7
30 2 1.2 81.9
31 3 1.8 83.6
32 1 0.6 84.2
34 2 1.2 85.4
37 3 1.8 87.1
38 1 0.6 87.7
39 2 1.2 88.9
40 1 0.6 89.5
41 1 0.6 90.1
42 2 1.2 91.2
43 1 0.6 91.8
45 1 0.6 92.4
49 1 0.6 93.0
53 3 1.8 94.7
54 1 0.6 95.3
59 1 0.6 95.9
63 1 0.6 96.5
69 1 0.6 97.1
73 1 0.6 97.7
79 1 0.6 98.2
84 1 0.6 98.8
143 1 0.6 99.4
153 1 0.6 100.0
3600 Samples, 171 Periods
Period Count: 21.1 average, 16.3 median
"5 AM run"
Period Count Instances Percent Cumulative
1 11 2.0 2.0
2 1 0.2 2.2
3 17 3.1 5.4
4 87 16.1 21.4
5 122 22.6 44.0
6 114 21.1 65.1
7 62 11.5 76.5
8 46 8.5 85.0
9 30 5.5 90.6
10 8 1.5 92.1
11 7 1.3 93.3
12 5 0.9 94.3
13 2 0.4 94.6
14 5 0.9 95.6
15 2 0.4 95.9
16 4 0.7 96.7
17 3 0.6 97.2
18 2 0.4 97.6
19 3 0.6 98.2
20 2 0.4 98.5
21 2 0.4 98.9
22 1 0.2 99.1
25 1 0.2 99.3
26 1 0.2 99.4
28 1 0.2 99.6
40 1 0.2 99.8
45 1 0.2 100.0
3600 Samples, 541 Periods
Period Count: 6.7 average, 5.3 median
Hope this helps,
/tvb
|