Well, this was an unexpected surprise for someone like me that collects and measures clocks as a hobby. Why on earth is did my pendulum clock jump 0.2 milliseconds today?
USGS says "a magnitude 7.0 earthquake struck north of Anchorage, Alaska on November 30, 2018 at 8:29 a.m. local time (17:29:28 UTC)". Although it was a large earthquake, Alaska is about 1500 miles away from Washington. We live in the greater Seattle area and felt absolutely nothing.
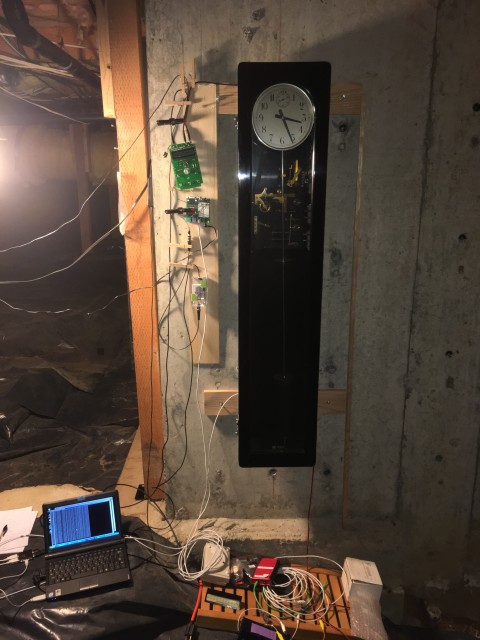
But I have a Synchronome pendulum clock and it definitely "felt" something! The Synchronome is running in the basement and recently I have been continuously logging its performance down at the microsecond level. The effect of an earthquake, even if very far away and undetectable by humans, is dramatic to a precision pendulum clock. The clock was disturbed for as much as 20 minutes and lost nearly 200 microseconds due to the event. Ok, that's only 0.2 milliseconds, or 0.0002 seconds. Invisible to the human eye. But don't laugh, we pendulum guys take our clocks seriously!
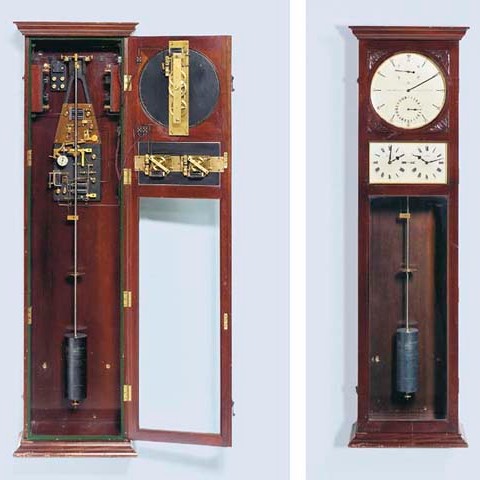
Certainly many other pendulum clocks are better looking, but the Synchronome was designed by engineers for engineers. Consequently it lacks most of the artistic frills of the typical grandfather clock. Note that this model of generic Synchronome clock (similar to the one I own) is not the exotic vacuum chamber Shortt-Synchronome clock (which I could never possibly afford).
It never occured to me that an earthquake up in Alaska would affect a pendulum clock here in Washington. But with some quick internet searches, I could see that the glitch in the pendulum data was closely correlated with the quake. How cool is that.
Below is a plot of pendulum error (aka time offset, phase difference):
Below is a plot of pendulum period (aka pendulum 1/rate, 1/frequency). The typical variation in 2 second period is 2 µs RMS but the earthquake caused peak-to-peak excursions approaching ±150 µs. If this looks like a seismogram, yes, it should. Some seismometers are in fact based on a pendulum, but designed for vibration recording rather than timekeeping.
Below is a plot of pendulum amplitude (in degrees, mrad, or cm):
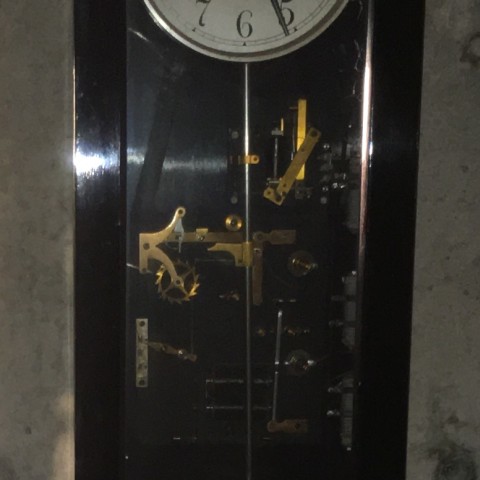
A dim view into the clock showing the count wheel and gravity arm escapement:
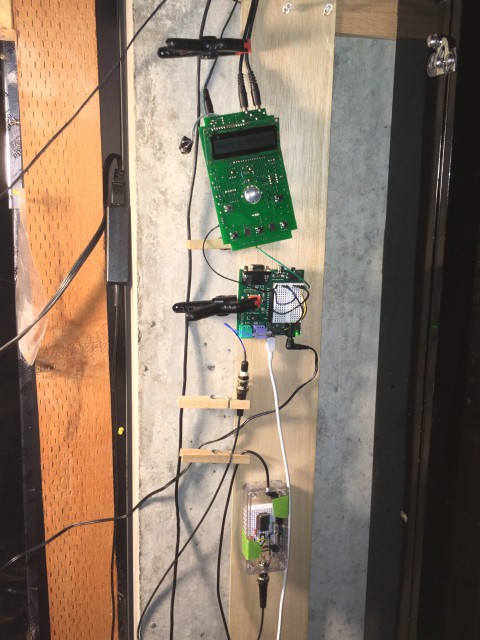
At the time of the quake I happened to be collecting data using multiple timers. One has ~5 µs resolution; the other two are 400 ns and 10 ns. The consistency of the timers confirms the erratic data was not due to optics or electronics but the pendulum clock itself. The magnitude, shape, and UTC timing of the disturbance suggest an earthquake origin.
Below are two side-by-side plots showing seismic activity in Fairbanks, Alaska. On the left is the day of the earthquake (30-Nov). On the right is a typically quiet day (3-Dec).
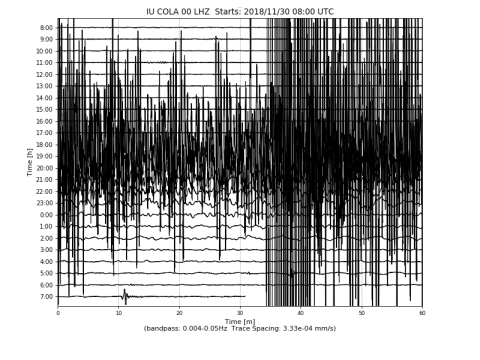
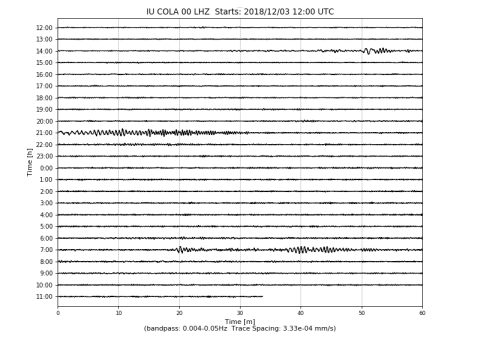
Click for full-res: usgs-2018-11-30-08h-COLA.png and usgs-2018-12-03-12h-COLA.png
Much closer to home, below are two side-by-side plots showing seismic activity at Hanford, Washington. On the left is the day of the earthquake (30-Nov). On the right is a typically quiet day (3-Dec).
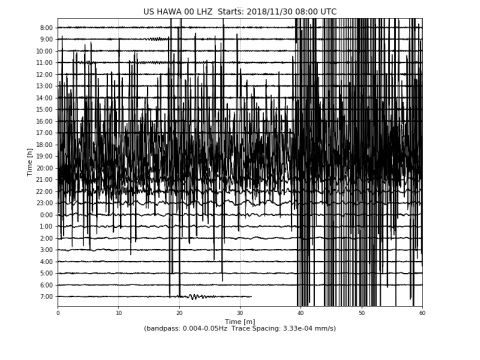
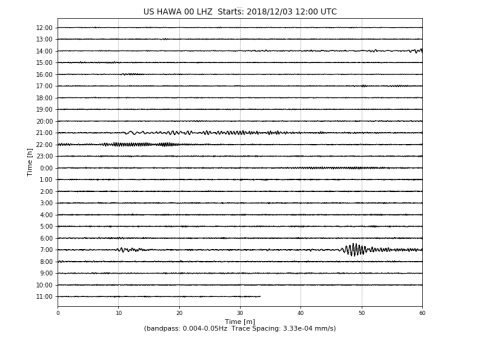
Click for full-res: usgs-2018-11-30-08h-HAWA.png and usgs-2018-12-03-12h-HAWA.png
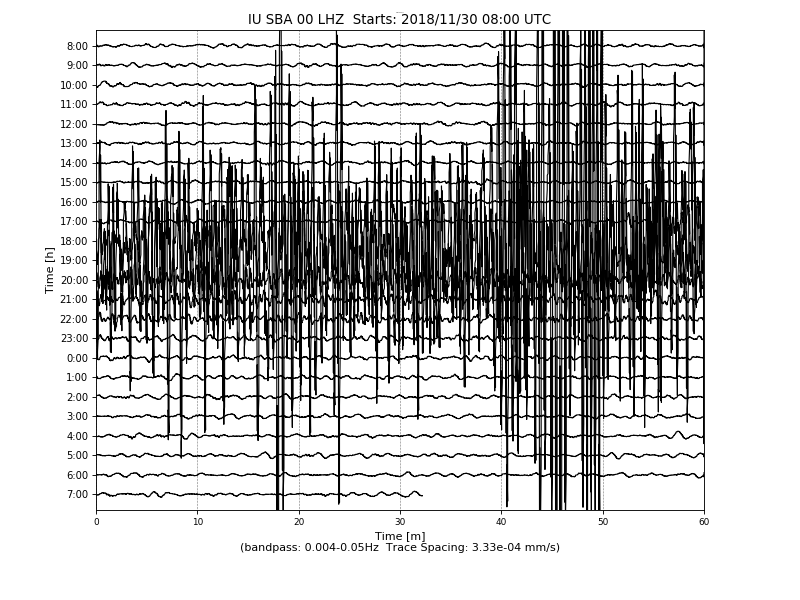
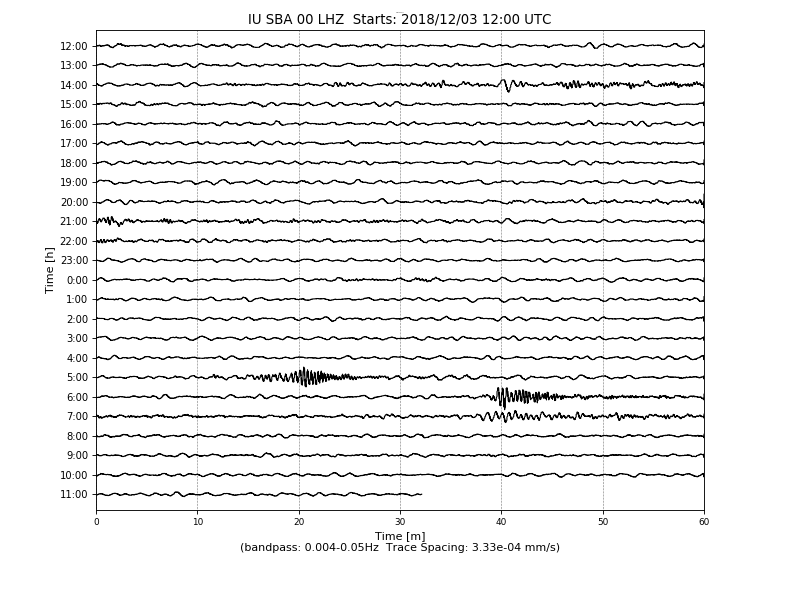
To appreciate what it looks like at the end of the earth, below are two side-by-side plots showing seismic activity at Scott Base, Antarctica. On the left is the day of the earthquake (30-Nov). On the right is a typically quiet day (3-Dec).
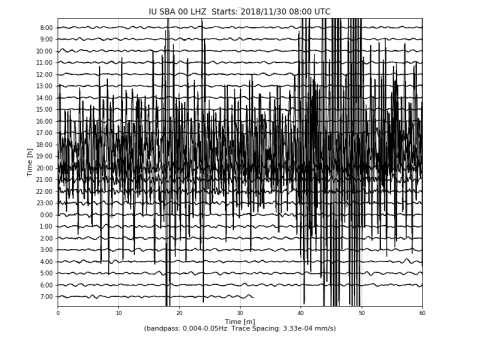

Click for full-res: usgs-2018-11-30-08h-SBA.png and usgs-2018-12-03-12h-SBA.png