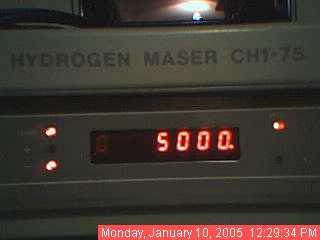
The KVARZ CH1-75 active hydrogen maser has a cavity auto-tuning mode (AFCC I) requiring an extremely stable external frequency reference. In my lab a Sigma Tau maser provides the stable 100 MHz reference for the KVARZ maser tuning. The tuning is accomplished by varying the voltage to a varactor diode inside the cavity (the variable capacitance slightly changes the cavity Q). A 12-bit DAC generates the voltage. Every other 1, 10, 100, or 1000 seconds (user selectable), based only on the sign of the measurement, the DAC is incremented or decremented by one. The current DAC value can be displayed (as a 4-digit octal) on the front of the instrument.
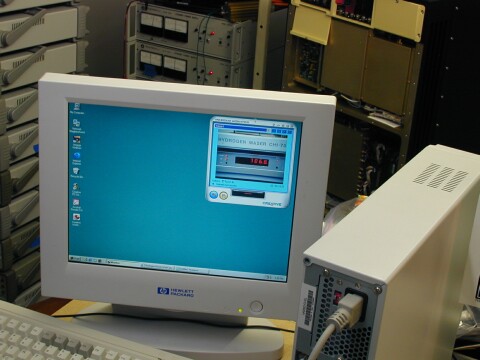
Since the instrument does not have an RS-232 status interface I'm using a webcam to periodically capture the front panel displayed DAC value in order to generate long-term cavity tuning plots. The pixels of the LED digits in the JPG snapshot images are converted to an ASCII log file with a homebrew OCR software tool. Graphs of this growing log file are then made using a homebrew plot tool.
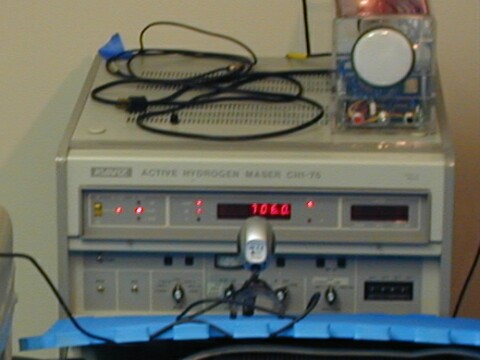
Below is a live photo of the maser:
| Maser front panel (photo updated every 30 minutes) |
|
Below are live short- and long-term plots of variations in the DAC voltage. Each octal LED display value is converted to a decimal percent of DAC range for these plots. For example, a display value of 6671 (base 8) is 3513 (base 10) which is 85.79% of 4095 (the maximum value of a 12-bit DAC; 212 = 4096).
The small steps reveal the resolution of the 12-bit DAC. A full-range change of the DAC changes the maser output frequency by about 2.7e-12 so a 1% DAC change is 2.7e-14, a 0.1% change is 2.7e-15, and a one bit DAC change is 6.6e-16. In the plot below a 0.2% DAC change represents a 5e-15 frequency correction.
Since the cavity tuning algorithm in the CH1-75 can only adjust the DAC by +1 or -1 and never 0, the maser is changing frequency by half a part in 1015th every 2000 seconds. This explains why the mid-term stability of this maser is not as good when in cavity tuned mode. When conditions are ideal the DAC bounces up and down by just one or two for an extended period of time with no obvious trend.
| Most recent 3 days (plot updated every 30 minutes) |
 |
The following long-term plot shows some slight diurnal peaks at times, a general downward trend, and other unexplained variations. With enough data and correlation with other lab measurements perhaps this can be better understood (that's the goal of this project). The occasional gaps in the plots are when the logging PC is offline. A perfectly flat line probably indicates the maser is in FM or Fm, free-run mode (i.e., manual cavity tuning).
| Most recent 3 weeks (plot updated every hour) |
 |
Here is a plot of the full data set to date:
| Most recent 3 months (plot updated every day) |
 |
With several months of data a trend is visible. The cavity has been tuned about -3% of the DAC range in about 50 days. Since 1% is 2.7e-14, the slope is -3 * 2.7e-14 / 50, giving us a maser drift rate of 1.6e-15 per day.
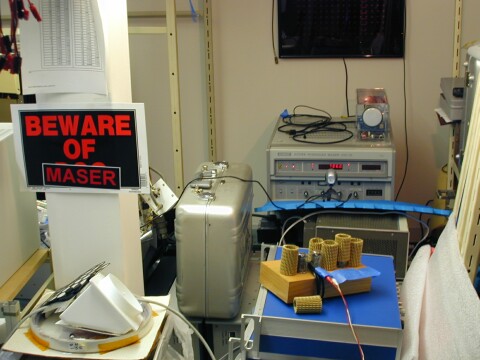
Here are a couple of photos of the lab showing the webcam placement in front of the maser and the PC running the time-lapsed image capture, plotting, and secure FTP upload software.